
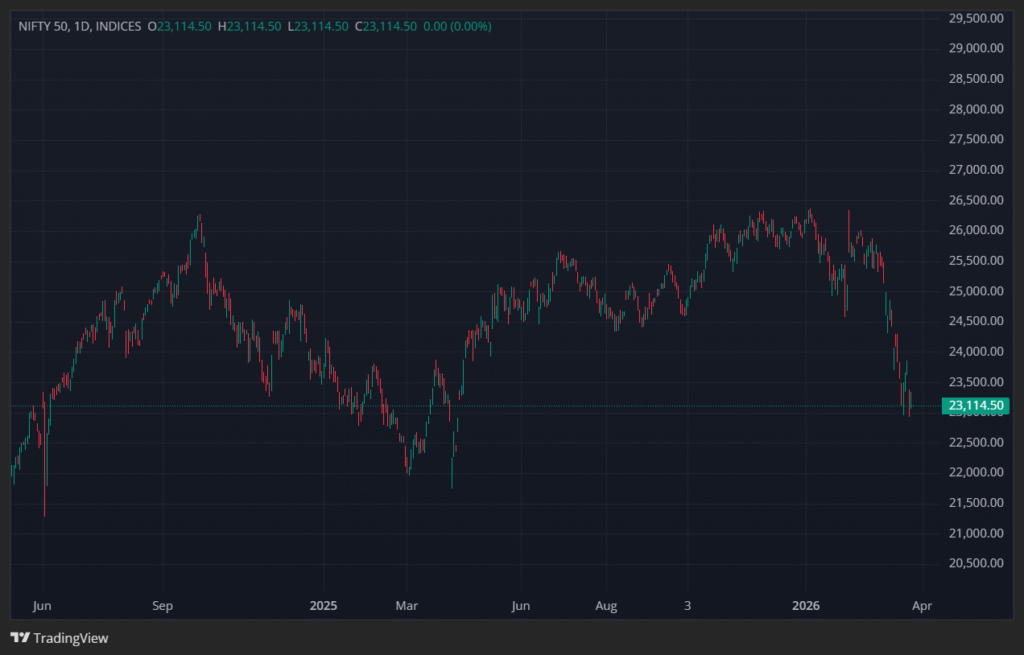
Indian stock markets are entering a crucial phase as the benchmark Nifty 50 shows signs of weakness on the daily timeframe. The chart you shared clearly reflects a sharp correction from recent highs near 26,000 levels toward the current zone around 23,100. This kind of fall is not just technical—it is deeply connected with global developments, especially tensions involving United States and Iran, along with volatility in Brent Crude prices.
This article breaks down the Nifty chart, explains the global backdrop, crude oil dynamics, and provides a realistic outlook for the coming week.
Technical Analysis of Nifty (Daily Chart)
From the chart, three major phases are clearly visible:
1. Previous Uptrend (March 2025 – January 2026)
Nifty was in a strong bullish trend, forming higher highs and higher lows. The index moved from around 21,500 to nearly 26,200. This rally was supported by strong domestic flows (DII buying), stable global cues, and controlled inflation.
2. Distribution Phase Near Top (January – February 2026)
Around the 25,500–26,200 zone, the market started showing weakness:
- Multiple rejections from resistance
- Formation of lower highs
- Increased volatility
This is typically a sign of “smart money” exiting.
3. Sharp Breakdown (March 2026)
Now the most important part:
- Nifty broke key support zones (24,500 and 24,000)
- Strong red candles indicate panic selling
- No major pullback → indicates strong bearish momentum
Currently, Nifty is trading near 23,100, which is a crucial psychological and technical level.
Key Support and Resistance Levels
Support Zones
- 23,000 – 22,800 → Immediate support (current zone)
- 22,200 – 22,000 → Strong demand zone (previous swing low)
- If broken → possible fall toward 21,500
Resistance Zones
- 23,800 – 24,000 → First resistance
- 24,500 → Major breakdown level
- Above 24,500 → bullish recovery possible
What Chart Indicates for Next Week
Based on the current structure:
Bearish Scenario (Higher Probability)
- If Nifty fails to sustain above 23,000:
- It can fall toward 22,500 → 22,000
- Weak sentiment will continue
- Selling on rise likely
Bullish Pullback Scenario
- If Nifty holds 23,000 and forms a base:
- Short covering rally possible up to 23,800–24,200
- But this will likely be a dead cat bounce, not trend reversal
👉 Conclusion: Trend is bearish unless 24,500 is reclaimed
Global Factors Impacting Nifty
1. US–Iran Conflict Impact
Tensions between United States and Iran have created uncertainty in global markets. This has led to:
- Risk-off sentiment globally
- FIIs pulling money out of emerging markets like India
- Increased volatility in commodities
2. Energy Crisis in Asia
Due to disruptions in oil supply routes, Asian economies are facing:
- Rising energy costs
- Pressure on currency and inflation
India, being a major oil importer, is directly affected.
Brent Crude Oil and Its Impact
Brent Crude is one of the most important indicators right now.
Current Situation
- Crude prices have surged due to geopolitical tensions
- Supply fears from Middle East escalation
Impact on India
- Higher crude → higher inflation
- Rupee weakness
- Increased fiscal pressure
Stock Market Effect
- Negative for:
- Airlines
- Paint companies
- FMCG (due to margin pressure)
- Positive for:
- Oil exploration companies (like ONGC)
- Refining companies (conditionally)
👉 Overall, rising crude is bearish for Nifty
FII and DII Behavior
FII (Foreign Institutional Investors)
- Likely selling due to global uncertainty
- Moving money toward safer assets like US bonds
DII (Domestic Institutional Investors)
- Supporting the market
- But cannot fully absorb heavy FII selling
👉 This imbalance is one reason for the sharp fall.
Market Sentiment Analysis
Current sentiment is:
- Fear-driven
- Highly reactive to news
- Weak technical structure
Indicators suggest:
- No strong buying momentum yet
- Market is in distribution to downtrend phase
Sectoral Impact
Weak Sectors
- IT (due to global slowdown fears)
- Banking (profit booking after rally)
- Auto (input cost pressure)
Relatively Strong
- Oil & Gas
- Defense stocks (due to geopolitical tensions)
What Traders Should Do
For Short-Term Traders
- Sell on rise strategy
- Avoid aggressive buying
- Focus on levels:
- Sell near 23,800–24,000
- Stop loss above 24,500
For Investors
- Avoid panic selling
- Wait for strong support (22,000 zone)
- Accumulate gradually, not all at once
Possible Scenarios for Next Week
Scenario 1: Continued Fall
- Nifty breaks 23,000
- Moves toward 22,500
- High volatility
Scenario 2: Consolidation
- Range between 23,000–24,000
- Market waits for global clarity
Scenario 3: Short Covering Rally
- Bounce to 24,200
- But selling pressure resumes
Final Conclusion
The daily chart of Nifty 50 clearly shows a shift from bullish to bearish structure. The breakdown below key support levels, combined with global uncertainties and rising Brent Crude prices, indicates that the market is under pressure.
Geopolitical tensions involving United States and Iran are adding fuel to volatility, making the near-term outlook cautious.
👉 Next week bias: Bearish to sideways with high volatility
also see
- MAREKT NEWS
- Indian Refiners May Resume Iranian Oil Imports After US Sanctions Relief Big Impact on Crude Market
- India’s Urea Imports from China Hit 3-Year High Amid Rising Fertiliser Demand